当诊断ASM问题时,如果知道ASM磁盘组名,磁盘组类型,磁盘状态,ASM实例初始化参数,与是否有rebalance操作在执行,对于诊断都是有帮助的。在这些情况下,通常会生成一个html格式的报告,通过在ASM实例中运行SQL脚本来生成。该脚本如下:
[grid@jyrac1 ~]$ cat asm_report.sql

spool /home/grid/ASM_report.html
set markup html on
set echo off
set feedback off
set pages 10000
break on INST_ID on GROUP_NUMBER
prompt ASM report
select to_char(SYSDATE, 'DD-Mon-YYYY HH24:MI:SS') "Time" from dual;
prompt Version
select * from V$VERSION where BANNER like '%Database%' order by 1;
prompt Cluster wide operations
select * from GV$ASM_OPERATION order by 1;
prompt
prompt Disk groups, including the dismounted disk groups
select * from V$ASM_DISKGROUP order by 1, 2, 3;
prompt All disks, including the candidate disks
select GROUP_NUMBER, DISK_NUMBER, FAILGROUP, NAME, LABEL, PATH, MOUNT_STATUS, HEADER_STATUS, STATE, OS_MB, TOTAL_MB, FREE_MB, CREATE_DATE, MOUNT_DATE, SECTOR_SIZE, VOTING_FILE, FAILGROUP_TYPE
from V$ASM_DISK
where MODE_STATUS='ONLINE'
order by 1, 2;
prompt Offline disks
select GROUP_NUMBER, DISK_NUMBER, FAILGROUP, NAME, MOUNT_STATUS, HEADER_STATUS, STATE, REPAIR_TIMER
from V$ASM_DISK
where MODE_STATUS='OFFLINE'
order by 1, 2;
prompt Disk group attributes
select GROUP_NUMBER, NAME, VALUE from V$ASM_ATTRIBUTE where NAME not like 'template%' order by 1;
prompt Connected clients
select * from V$ASM_CLIENT order by 1, 2;
prompt Non-default ASM specific initialisation parameters, including the hidden ones
select KSPPINM "Parameter", KSPFTCTXVL "Value"
from X$KSPPI a, X$KSPPCV2 b
where a.INDX + 1 = KSPFTCTXPN and (KSPPINM like '%asm%' or KSPPINM like '%balance%' or KSPPINM like '%auto_manage%') and kspftctxdf = 'FALSE'
order by 1 desc;
prompt Memory, cluster and instance specific initialisation parameters
select NAME "Parameter", VALUE "Value", ISDEFAULT "Default"
from V$PARAMETER
where NAME like '%target%' or NAME like '%pool%' or NAME like 'cluster%' or NAME like 'instance%'
order by 1;
prompt Disk group imbalance
select g.NAME "Diskgroup",
100*(max((d.TOTAL_MB-d.FREE_MB + (128*g.ALLOCATION_UNIT_SIZE/1048576))/(d.TOTAL_MB + (128*g.ALLOCATION_UNIT_SIZE/1048576)))-min((d.TOTAL_MB-d.FREE_MB + (128*g.ALLOCATION_UNIT_SIZE/1048576))/(d.TOTAL_MB + (128*g.ALLOCATION_UNIT_SIZE/1048576))))/max((d.TOTAL_MB-d.FREE_MB + (128*g.ALLOCATION_UNIT_SIZE/1048576))/(d.TOTAL_MB + (128*g.ALLOCATION_UNIT_SIZE/1048576))) "Imbalance",
count(*) "Disk count",
g.TYPE "Type"
from V$ASM_DISK_STAT d , V$ASM_DISKGROUP_STAT g
where d.GROUP_NUMBER = g.GROUP_NUMBER and d.STATE = 'NORMAL' and d.MOUNT_STATUS = 'CACHED'
group by g.NAME, g.TYPE;
prompt End of ASM report
set markup html off
set echo on
set feedback on
exit
为了生成报告并保存为/home/grid/ASM_report.html,以Grid Infrastructure用户(通常为grid或oracle)来执行
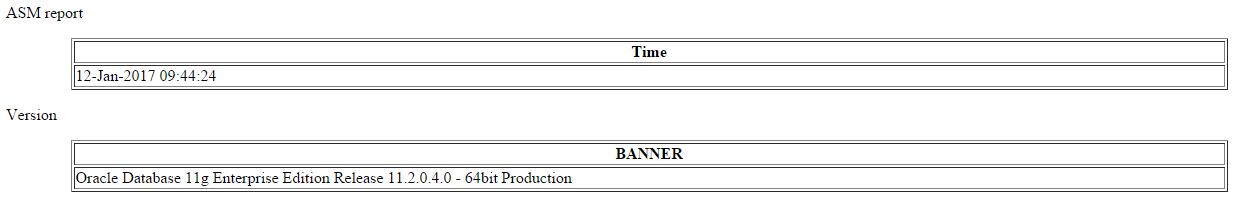
[grid@jyrac1 ~]$ sqlplus / as sysasm @asm_report.sql

SQL*Plus: Release 11.2.0.4.0 Production on Thu Jan 12 09:44:24 2017

Copyright (c) 1982, 2013, Oracle.  All rights reserved.


Connected to:
Oracle Database 11g Enterprise Edition Release 11.2.0.4.0 - 64bit Production
With the Real Application Clusters and Automatic Storage Management options

ASM report
| Time |
|---|
| 12-Jan-2017 09:44:24 |
Version
| BANNER |
|---|
| Oracle Database 11g Enterprise Edition Release 11.2.0.4.0 – 64bit Production |
…..
NORMAL
End of ASM report
SQL> set feedback on SQL> exit Disconnected from Oracle Database 11g Enterprise Edition Release 11.2.0.4.0 – 64bit Production With the Real Application Clusters and Automatic Storage Management options
报告内容
报告首先显示了报告生成的时间与ASM的版本。
如果存在执行的任何ASM操作将会显示,我这里没有正在执行的ASM操作。所以Cluster wide operations下面没有内容。
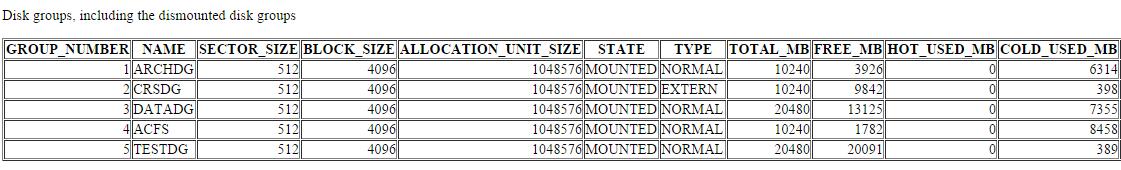
接下来可以看到所有磁盘组,包含dismounted磁盘组。
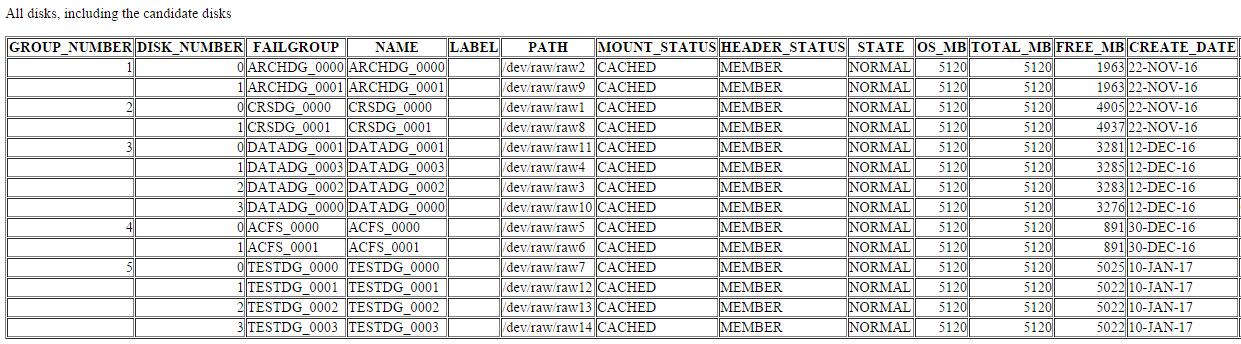
接下来可以看到磁盘,也会包含那些状态为candidate的磁盘
接下来是关于脱机磁盘的信息,因为我这里没有脱机磁盘,所以该部分内容为空
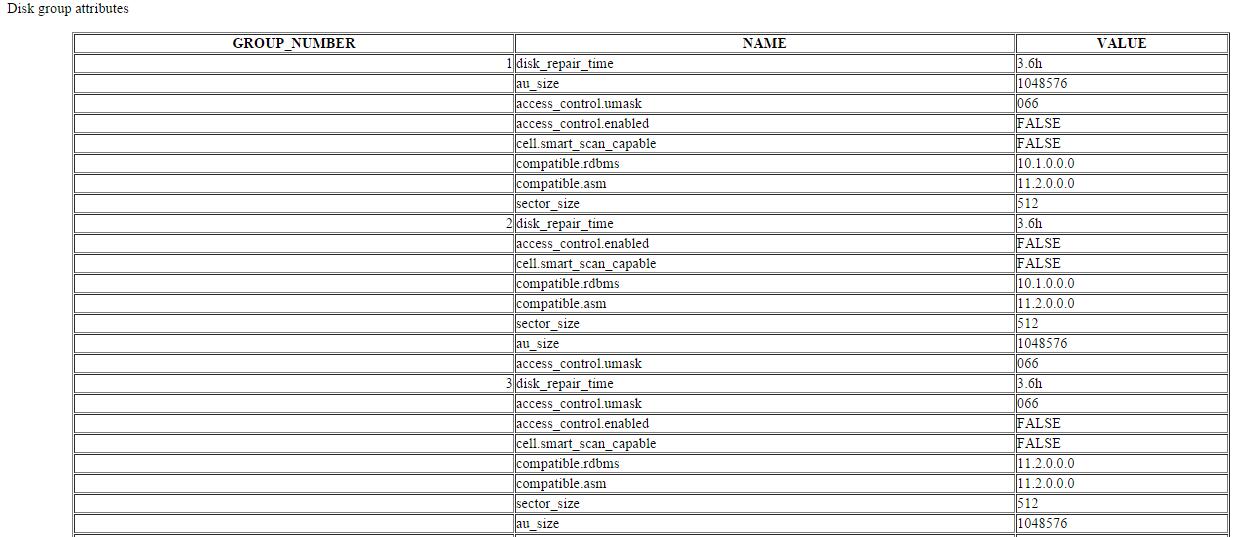
再接下来就是磁盘组属性
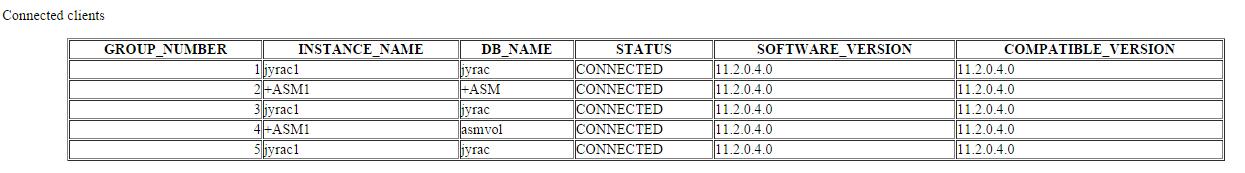
接下来是连接到ASM的客户端
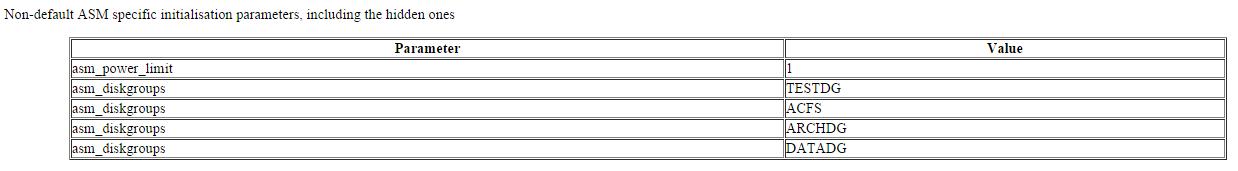
ASM初始化参数包含隐含参数与一些Exadata特定参数(_auto_manage)
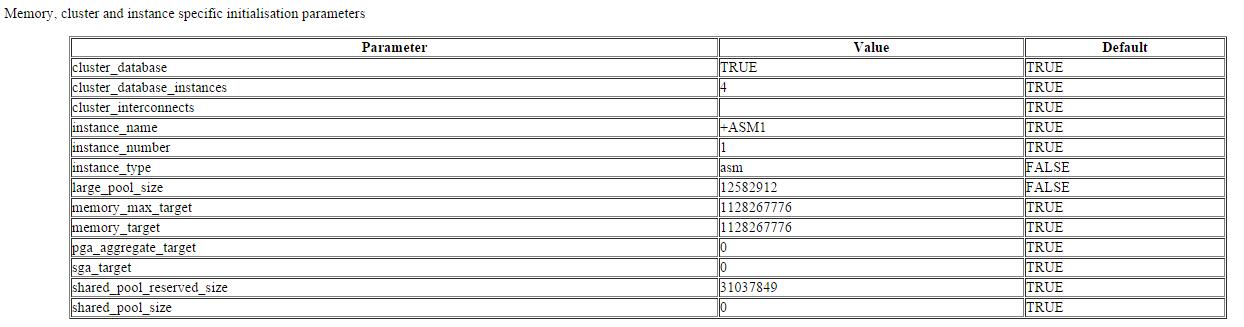
内存,集群与实例特定参数
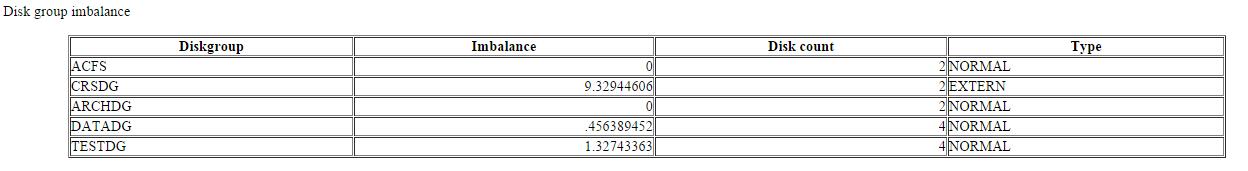
最后是磁盘组不平衡信息
小结:
使用这个报告可以快速查看ASM相关信息,它也可以作为ASM设置的一种备份。